- EverythingDevOps
- Posts
- The Easier Way to Trace Distributed Systems
The Easier Way to Trace Distributed Systems
What if visibility across your services came out of the box instead of after hours of setup?
Divine Odazie
November 03, 2025

Hey there,
Imagine managing an e-commerce platform where a single checkout involves six different services talking to each other across multiple servers. One day, users start reporting delayed order confirmations.
You check authentication, payment gateway, order management, everything looks fine, but thirty minutes later, you're still hunting through logs trying to figure out where things broke down.
Your monitoring says something failed, but what it doesn't tell you is why it did, where in the chain the failure occurred, or how the services interacted when it happened.
In today's issue, we explore:
Why visibility across distributed services matters more than ever
The real cost of manual tracing setup in production environments
How automated instrumentation changes the debugging game
Let's dive in.
Was this email forwarded to you? Subscribe here to get your weekly updates directly into your inbox.
From Logs to full context
When your application spans multiple services across different servers and regions, a single user action triggers dozens of interactions. Authentication calls the product catalog, the cart service talks to inventory, and checkout hits payment processing, which connects to order management.
Distributed tracing closes that visibility gap by assigning each request a unique trace ID that follows it through every service interaction. Each step gets captured as a "span" containing timing data, error details, and context about what happened. When you connect these spans, they form a complete map of the request's journey, and where things might be slowing down.
While tracing brings clarity to complex systems, getting it set up across multiple services isn’t always straightforward. OpenTelemetry, the CNCF standard for traces, metrics, and logs, gives you fine-grained control but requires a deliberate setup process.
You’ll need to:
Configure environment variables for your backend
Initialize global tracers across services
Add interceptors to propagate trace data
Instrument HTTP handlers for request capture
Set up an external dashboard like Jaeger for visualization
Even a simple two-service demo, such as an HTTP gateway calling a gRPC checkout service, involves multiple configuration steps. When that setup expands to ten or more services, maintaining it quickly turns into a project on its own.
How Encore simplifies tracing
Maintaining tracing shouldn’t take more effort than solving the actual issue. That’s the kind of complexity Encore set out to remove by making tracing automatic.
Take a simple setup with order processing and notification services. All you do is write your Go code, run encore run, and open the local dashboard.
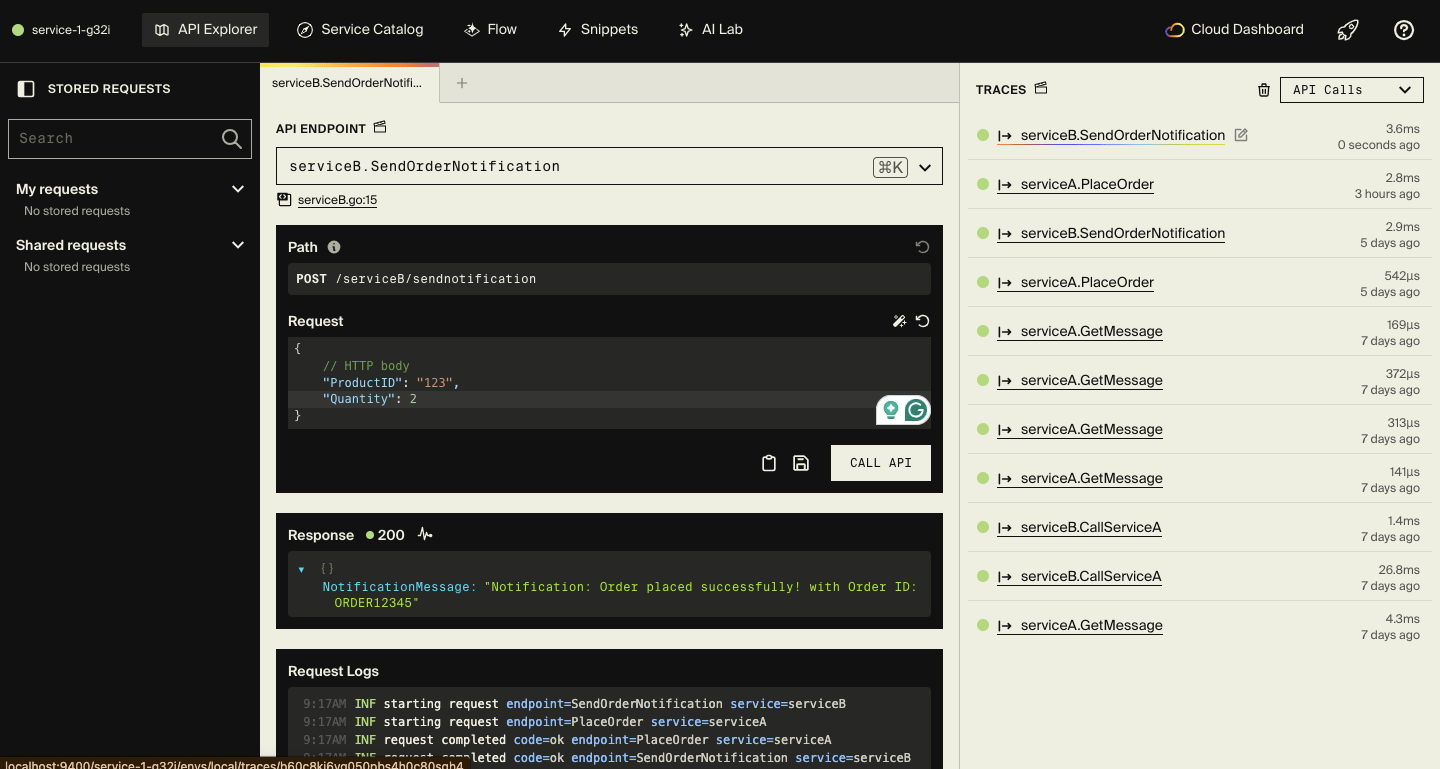
Right away, you can see traces of requests flowing between services, API performance data, a catalog of endpoints with full request and response details, and a clear architecture diagram, all generated for you.
Encore goes even further by managing your infrastructure, encrypting secrets by default, and keeping your local and cloud environments in sync across providers like AWS and GCP.
Check out the full guide here for a hands-on look at setting up distributed tracing in Encore, and links to other resources you’ll find helpful.
And it’s a wrap!
See you Friday for the week’s news, upcoming events, and opportunities.
If you found this helpful, share this link with a colleague or fellow DevOps engineer.
Divine Odazie
Founder of EverythingDevOps
Got a sec?
Just two questions. Honest feedback helps us improve. No names, no pressure.